


A New Approach of Measuring an AI + Human Claims Team Effectiveness
The metrics that show what a combined AI and human claims operation is actually producing, and the ones that hide it.
6 min read
Claims leaders can tell you what a large loss costs to handle. Far fewer can tell you what it costs to classify a document, chase a missing photo, or send the third status update on a file that hasn’t moved.
Those actions sit below the resolution of your reporting. They’re too small to get a line on a monthly pack, too routine to argue about, and too frequent to ignore once you actually count them.
Two minutes. Forty times a day. One hundred adjusters. Two hundred and forty working days. That’s 32,000 hours a year, or roughly 17 adjusters doing nothing else.
That’s the measurement problem in an AI-native claims operation. Agentic AI removes exactly the work your reporting was never built to see, so the gains land in the adjuster’s day long before they land in a business case.
This article covers how claims leaders can measure the combined AI and human team and the arithmetic behind it.
What you will learn:
- Why the standard claims scorecard misses what agentic AI changed
- A five-layer measurement framework with paired quality measures
- How to price a routine task so the gain becomes a number
- How to set a baseline you can defend to finance and audit review
Why does the standard claims scorecard miss what agentic AI changed?
Claim-level metrics like cycle time, closure rate, and STP rate are too holistic to register a task-level change. The work agentic AI removes happens inside claims that still need an adjuster. The financial case fails because the time returned was never priced, and the tasks it came from were never counted.
The industry data says this plainly. In Capgemini’s World Property and Casualty Insurance Report 2026, 42% of insurers track no AI metrics at all, and 55% cite the absence of a clear return on their AI initiatives. Only 10% are scaling successfully, while 60% remain in exploration or proof of concept.
Read those two numbers together. More than half the market can’t find the return, and more than four in ten aren’t measuring for it. The gains are missing from the instrumentation.
There’s a structural reason. Claims reporting was built around the claim as the unit: cycle time, indemnity, LAE, closure rate. Agentic AI works below that level, on tasks. A claim that took 21 days before and 19 days after reads as noise, and the 40 administrative actions the AI absorbed inside those 19 days appear nowhere.
Straight-through processing rate shares the blind spot. It counts claims that needed no human from open to close, which says nothing about routine work removed from the claims that still need human judgment. We’ve written about why STP rate stalls near 10% and what belongs beside it.
What should you measure on a combined AI and human claims team?
Measure at five layers, and pair every productivity measure with a quality measure at the same layer. Speed that generates corrections isn’t capacity.
Layer | Productivity measure | Paired quality measure |
|---|---|---|
Task | Minutes per routine task; volume completed without a human touch | Correction rate on automated output, by task type |
Claim | Active work time per claim; touches per claim | Rework and reopen rate |
Adjuster | Decisions handled per adjuster per week | Override rate, with a reason attached to every override |
Supervisor | Claims overseen per supervisor; review load | Findings from audit samples of work that was never escalated |
Policyholder | Response time; days waiting on missing information | Complaint rate and documentation completeness |
Three rules make this scorecard defensible.
- Never report a productivity number without its pair. A 40% cut in document handling time that arrives with a rising correction rate is a quality problem wearing a productivity costume, and your audit team will find it before your board does.
- Segment overrides by reason, not just volume. An override can signal a data gap, an unclear rule, a new claim pattern, or a coaching need. Each calls for a different fix, and the count alone tells you none of them.
- Sample the work that was never escalated. If supervisors only review exceptions, automated work that was quietly wrong never enters the sample. Pull a random slice of non-escalated decisions on a fixed cadence.
The policyholder layer earns its row. J.D. Power’s 2026 US Property Claims Satisfaction Study put the average time to final payment at 40.7 days. Most of that clock is waiting, and waiting is made of small unfinished actions.
Building the operating model behind these measures?
The full six-step framework covers task mapping, ownership, handoff design, queue redesign, adoption, and measurement.
What does a two-minute task actually cost?
Price a routine task by multiplying its duration, its daily frequency, the number of adjusters who perform it, and your working year. Frequency does the work, which is why small tasks produce large numbers.
The tasks that matter most on the task layer are the ones that never got timed. Classifying a document. Chasing a missing photo. Sending the third status update on a file that hasn’t moved.
Here’s the model. The values below are illustrative inputs, not benchmark data. Replace each one with a figure from your own operation.
Input | Illustrative value | Where your number comes from |
|---|---|---|
Minutes per occurrence | 2 | Timed sample of 20–30 real occurrences |
Occurrences per adjuster per day | 40 | Task counts from your CMS audit log |
Adjusters in scope | 100 | Headcount in the segment you’re automating |
Working days per year | 240 | Your calendar, net of leave and holidays |
Annual hours | 32,000 | 2 × 40 × 100 × 240 ÷ 60 |
Adjuster-years at 1,920 hours | ~16.7 | 32,000 ÷ 1,920 |
Annual wage cost | ~$1.18M | 32,000 × $36.92 |
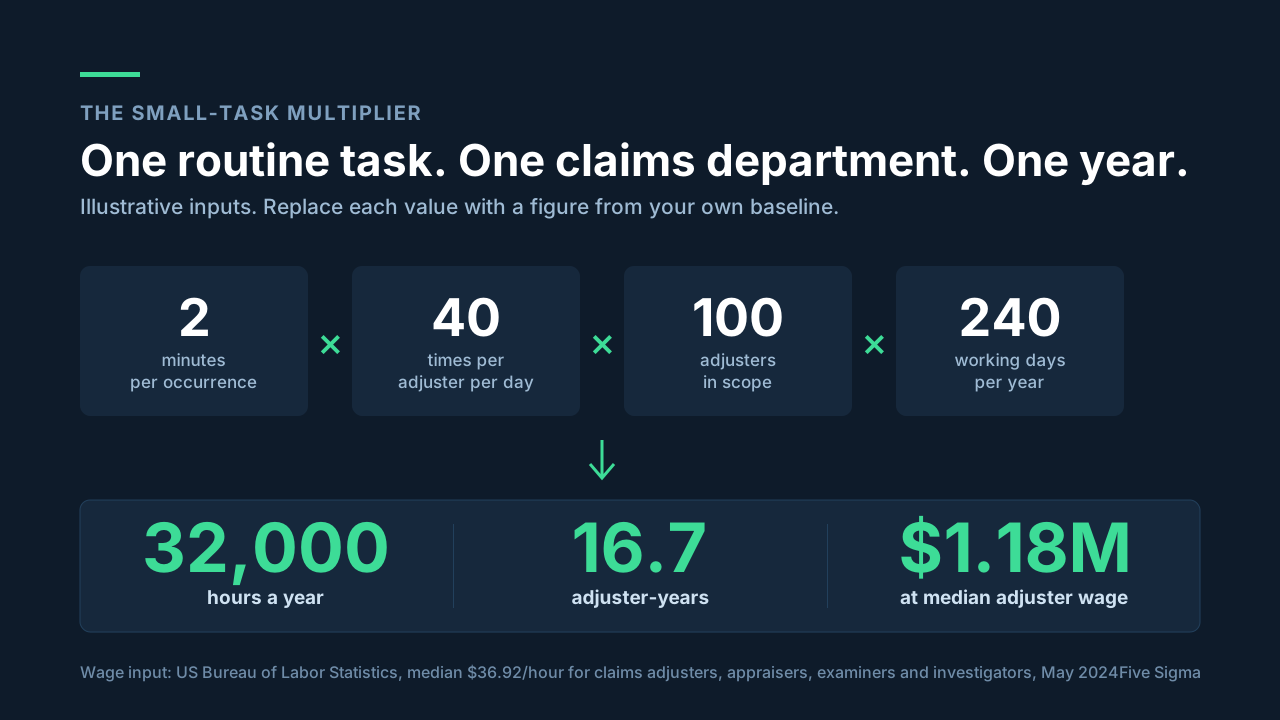
The wage input is the one number here with a public source: the US Bureau of Labor Statistics puts median pay for claims adjusters, appraisers, examiners, and investigators at $76,790 a year, or $36.92 an hour as of May 2024. Apply your own fully loaded multiplier for benefits and overhead, state the multiplier openly, and 32,000 hours lands near $1.5 million at 1.3x.
Eighty minutes a day is 16.7% of an eight-hour shift. That’s the share of a claims department the small stuff quietly consumes.
Switching cost sits on top of that. Research published in Harvard Business Review found workers toggling between applications roughly 1,200 times a day, costing just under four hours a week reorienting, about 9% of annual work time. Small sample, 137 people across three Fortune 500 companies, so read it as directional.
US property and casualty insurers recorded $86.0 billion in loss adjustment expense against $958.7 billion in net premiums earned in 2025, per the NAIC’s full-year industry analysis. Roughly 9 cents of every premium dollar goes to the cost of handling claims, and a large share of it is paid out in two-minute increments.
How do you build a baseline you can defend?
Measure the same task, the same team, and the same claim segment before and after. A credible performance claim is explainable: what was measured, for how long, for whom, and against what.
- Pick one claim type and one time window. A single high-volume line and a 90-day baseline. Broad averages across mixed portfolios don’t survive scrutiny.
- Count the task, don’t estimate it. Pull occurrence counts from CMS audit logs and timestamps. A workshop estimate is a hypothesis, not a baseline.
- Time a real sample. Twenty to thirty observed occurrences give you a duration you can defend. Record the range, not just the mean.
- Set the paired quality measure first. Capture correction, rework, and complaint rates before anything is automated, or you’ll have no way to prove quality held.
- Re-measure like for like. Same task, same team, same claim segment, same season if volume is seasonal. Report the comparison, then expand.
Stay conservative on what you claim. Time, cost, and capacity improvements can be calculated directly from your own process. Assertions about indemnity, loss ratio, or leakage need a measurement design that can carry them, and an operating claim you can defend builds more trust than an ambitious one you can’t.
How to put this into practice
Start with the task that annoys your best adjuster most. It’s usually high-frequency, low-judgment, and already well understood by the team. Baseline it, automate it, re-measure it against its quality pair. Then use that one defensible result to fund the next five.
Email handling is where many teams find their first credible figure. INSHUR cut claim email handling time in half with Clive AI, alongside a 33% reduction in the general claims queue. Email triage is a two-minute task that repeats dozens of times a day per adjuster, which is why it measures cleanly.
“Clive gave us measurable gains on paper, but more importantly, it unlocked momentum. We’re seeing faster responses, more streamlined workflows, and a clear path to scaling operations without scaling costs.”
Marc Mercer, Director of European Claims, INSHUR
Clive™, Five Sigma’s Multi-Agent AI Claims Expert, records what it did on every claim, so the task-level counts this scorecard depends on exist as operational data rather than a special study. Clive runs inside the Five Sigma CMS or on top of an existing claims system, and the baseline you build survives either deployment.
Measurement is step 6 of the operating model. The five steps before it decide whether there’s anything worth measuring.
See AI claims automation in action
See how Clive helps claims teams automate repetitive work and measure the impact.
Key takeaways
- Claim-level metrics can’t see task-level automation where agentic AI does most of its work.
- Measure at five layers, task, claim, adjuster, supervisor, and policyholder, and pair every productivity measure with a quality measure at the same layer.
- 42% of insurers track no AI metrics at all and 55% report no clear return (Capgemini, 2026), a measurement failure more often than a technology failure.
- A two-minute task performed 40 times a day by 100 adjusters over 240 days consumes 32,000 hours, close to 17 adjuster-years.
- A defensible baseline names the task, the team, the claim segment, the window, and the comparison.
Frequently asked questions
How do you measure an AI and human claims team?
Measure at five layers: minutes per routine task, active work time and touches per claim, decisions per adjuster, supervisor review load, and policyholder response time. Pair each with a quality measure such as correction rate, rework, override reasons, audit findings, or complaints.
What metrics should a claims team track after deploying AI?
Task-level counts and durations first, because that’s where agentic AI works. Then claim-level active work time, adjuster decision volume, supervisor span, and policyholder response time. Report no productivity number without its paired quality measure.
Is straight-through processing rate a good measure of claims AI?
On its own, no. STP rate counts claims closed with no human involvement and ignores routine work removed from claims that still need adjuster judgment. Use it alongside task-level measures of active work time and touches per claim.
How do you measure the ROI on AI in insurance claims?
Price the routine tasks the AI takes on. Multiply minutes per occurrence by daily frequency, adjusters in scope, and working days, then apply a fully loaded hourly cost. Pair the result with correction and rework rates so the saving holds up under audit.
How does AI claims automation compare with traditional claims processing on efficiency?
Traditional straight-through processing automation (STP) follows fixed rules and stops at exceptions, so gains concentrate in simple claims. Agentic AI completes routine tasks across simple and complex claims, escalates at defined decision boundaries, and continues afterwards, so active work time falls on files that still need an adjuster.
Which agentic AI solution works for complex claims?
Look for lifecycle coverage rather than a single task, defined decision boundaries with authority controls, decision-ready handoffs, full traceability of AI actions and human overrides, and task-level reporting. Five Sigma’s Clive is built for complex claims on this model.
Can agentic AI run on top of an existing claims system?
Yes. Clive runs on top of any existing claims system as an AI layer, or natively inside the Five Sigma CMS. The existing system stays the system of record in the layered deployment, and task-level measurement works in both.

Tirtza Bensoussan
Related resources
- Guide: Adjuster + Agentic AI: Building a Top-Performing Claims Team
- Blog: Why claims cycle time lies, and what to measure instead
- Blog: How agentic AI changes the claims operating model
- Blog: The claims shared inbox is a tax on your best adjusters
- Case Study: INSHUR cuts claim email handling time in half