New Reports & Dashboards Help You Make the Most of Your Claims Data
Our newest module helps you both to identify big-picture trends and to drill down into your claims data. Here’s what you need to know.
When it comes to empowering claims adjusters and entire claims organizations to optimize their performance, there are few resources as valuable as high-quality claims data. That principle has always guided the development of our claims management solution (CMS), and this week we’re excited to launch new capabilities that make it easier for you to tap into the power of your claims data.
Our new Reports & Dashboards module is now live, letting you view and analyze claims data through a user-friendly, embedded interface. The module’s two halves – detailed, automatically generated reports and big-picture, visual dashboards – offer two different approaches to leveraging data. But both features emphasize flexibility and convenience to make your data as usable and valuable as possible.
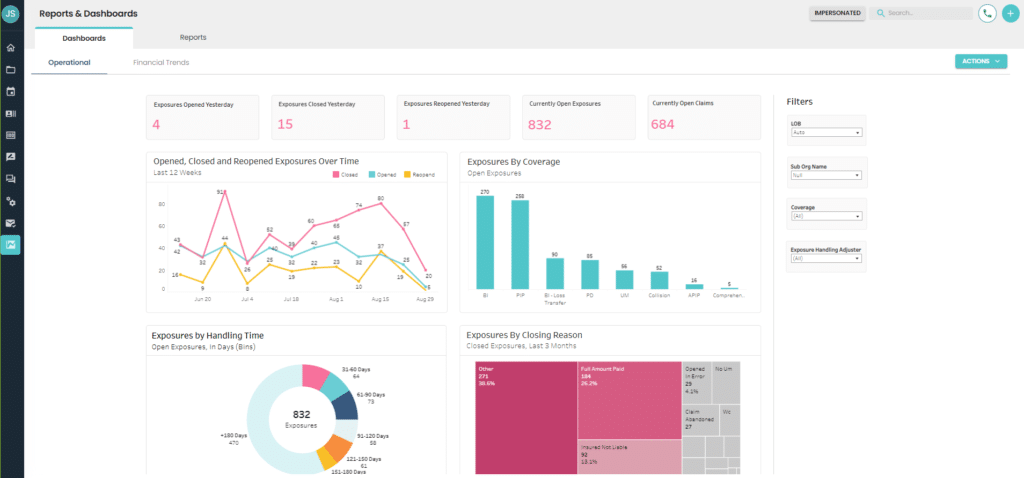
The Dashboards feature focuses on using data visualization to help you identify key trends that could affect the decisions you’ll want to make regarding your claims organization. The information here is divided into two dashboards: The Operational dashboard presents KPIs offering insight into your team’s handling of claims, while the Financial Trends dashboard provides key data on your reserves, payments made, and more. Each dashboard allows you to view graphs right within the interface, as well as exporting this information as an Excel, PDF, or CSV file. You can also filter the data to get a closer look.

The Reports & Dashboards Module’s Operational dashboard

The Reports & Dashboards Module’s Financial Trends dashboard
In contrast to that visual and broad approach to helping you identify trends, the Reports feature focuses on letting you take a deep dive into your claims data, examining raw numbers and drilling down to the level of the individual claim, exposure, or transaction. For each claim, exposure, or transaction, this feature provides detailed data on a wide variety of parameters. It also lets you filter and search this data based on an extensive list of parameters, making it easy to use your claims data in a granular way. And again, you can both view this data right within the interface and export it in the Excel, PDF, and CSV formats.

The Reports & Dashboards Module’s Claims report

The Reports & Dashboards Module’s Exposures report

The Reports & Dashboards Module’s Transactions report
How these new capabilities enhance the Five Sigma CMS
The bottom line? Accessing and analyzing your claims data just got easier, more convenient, more flexible, and more useful. With new capabilities for data visualization, you’ll now be even better equipped to identify your big-picture financial trends and to glean insights into how effectively you handle claims. And for a more fine-grained analysis of your claims data, you can drill down to the level of a specific claim, exposure, or transaction.
Taken together, these new capabilities add to our data-driven platform’s usefulness for claims adjusters and entire claims organizations. They complement our existing AI-powered claims intelligence capabilities, such as just-in-time guidance. They also build on our CMS’s approach to gathering, indexing, analyzing, and utilizing data as claims adjusters work, such as by automatically documenting their incoming and outgoing communications.
In short, while claims data has always been at the heart of how our claims management solution works, now you have an enhanced set of tools for accessing that data directly and using it to make well-informed decisions.
For more on our new Reports & Dashboards module, check out our press release.


